 23 hours Ago By Julian Horsey
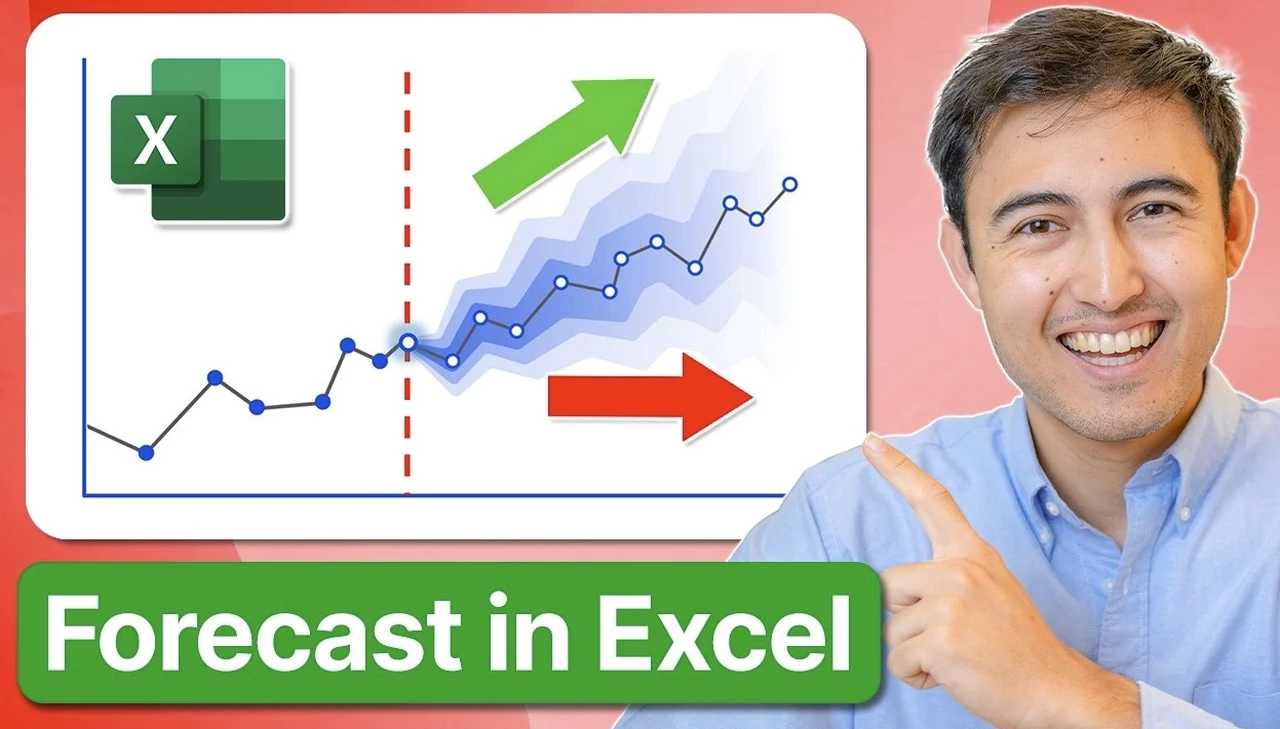
Excel forecasting is a for analysts aiming to boost productivity, cut costs, and enhance customer satisfaction. By harnessing Excel’s powerful forecasting tools, you can generate precise predictions that . Although it’s not just about crunching numbers, this article provides a roadmap to understanding how Excel’s forecasting functions can enable you to make informed decisions, even in the face of uncertainty.
From the straightforward FORECAST.LINEAR function, , to the more nuanced FORECAST.ETS that accounts for seasonality, Excel offers a range of options to suit different data patterns.
But don’t worry—you won’t need to become a math whiz overnight. This guide by Kenji will walk you through each function step-by-step, helping you understand when and how to use them effectively. By the end, you’ll not only be equipped to tackle your current forecasting challenges but also ready to explore advanced techniques that can refine your predictions even further.
Excel forecasting is a key skill for analysts, enabling precise predictions to guide strategic decisions. Key techniques include linear trend analysis, seasonality, and data visualization. The `FORECAST.
LINEAR` function in Excel is used for linear trend analysis, predicting future values based on historical data trends. The `FORECAST.ETS` function is used for datasets with recurring patterns, accounting for seasonality in time series data.
The `FORECAST.ETS.SEASONALITY` function in Excel helps determine cycle lengths in time series data, while the `FORECAST.
ETS.CONFINT` function provides confidence intervals, which are crucial for evaluating forecast reliability. Excel’s Forecast Sheet feature allows for easy creation of visual representations of data, aiding in communication of insights to stakeholders.
Choosing between linear and seasonal forecasting methods depends on the characteristics of the data. Linear forecasting is suitable for datasets with a steady trend, while seasonal forecasting is better for data with cyclical patterns. Excel offers a robust suite of forecasting functions, each designed to address specific analytical needs.
Familiarizing yourself with these tools is the first step towards becoming a proficient forecaster: FORECAST.LINEAR: Ideal for linear trend analysis FORECAST.ETS: Accounts for seasonality in time series data FORECAST.
ETS.SEASONALITY: Helps determine cycle lengths FORECAST.ETS.
CONFINT: Calculates confidence intervals The `FORECAST.LINEAR` function is fundamental for linear trend analysis, allowing you to predict future values based on historical data trends. This function excels when working with data that exhibits a consistent upward or downward trajectory.
For instance, it’s particularly useful when forecasting steady growth in sales or gradual declines in production costs. For datasets with recurring patterns, the `FORECAST.ETS` function proves invaluable.
It accounts for seasonality in time series data, offering nuanced forecasts by identifying patterns that repeat over time. This function is particularly beneficial in industries with seasonal demand fluctuations, such as retail or tourism. By incorporating seasonality, you can anticipate peaks and troughs in demand, allowing for more accurate inventory management and resource allocation.
Analyzing seasonality is vital when working with time series data. The `FORECAST.ETS.
SEASONALITY` function helps determine cycle lengths, revealing how often patterns repeat. Understanding these cycles allows you to make informed predictions and adjust strategies accordingly. For example, in the retail sector, identifying the length of seasonal cycles can help optimize inventory levels and marketing efforts throughout the year.
Calculating confidence intervals is crucial for evaluating forecast reliability. The `FORECAST.ETS.
CONFINT` function provides these intervals, offering a range within which future values are likely to fall. This insight is critical for risk management and strategic planning, allowing you to account for potential variability in your forecasts. Gain further expertise in Forecasting by checking out these recommendations.
Visualizing forecasts is a of the analytical process. Excel’s Forecast Sheet feature provides a straightforward way to create visual representations of your data, facilitating the communication of insights to stakeholders. By generating charts that display predicted trends and confidence intervals, you can present complex data in an accessible format.
To create impactful visualizations: Use line charts to illustrate trends over time Incorporate shaded areas to represent confidence intervals Add data points to show actual historical values alongside forecasts Use color coding to differentiate between actual and predicted values These visual elements enhance understanding and make your forecasts more compelling when presenting to decision-makers. Deciding between linear and seasonal forecasting methods depends on your data’s characteristics. Linear forecasting suits datasets with a steady trend, while seasonal forecasting is better for data with cyclical patterns.
Understanding these differences ensures you select the most appropriate method for your analysis. To determine the best approach: Analyze historical data for recurring patterns Consider the nature of your industry and its typical fluctuations Evaluate the time frame of your forecast Assess the impact of external factors on your data By carefully considering these factors, you can choose the forecasting method that will yield the most accurate and useful predictions for your specific scenario. As you become more proficient with basic forecasting techniques, consider exploring advanced methods to further refine your predictions: Multiple regression analysis for multi-variable forecasting Monte Carlo simulations for risk assessment Moving averages for smoothing out short-term fluctuations Exponential smoothing for weighted forecasts favoring recent data These advanced techniques can provide deeper insights and more accurate forecasts, particularly when dealing with complex datasets or volatile markets.
For those looking to deepen their expertise, numerous resources are available for financial modeling and valuation techniques in Excel. These resources can enhance your forecasting capabilities, allowing you to build comprehensive models that support strategic decision-making. Consider exploring: Online courses focused on Industry-specific forecasting techniques Advanced Excel functions for data analysis Best practices for model design and documentation By continually expanding your skills, you can stay at the forefront of Excel forecasting techniques and provide increasingly valuable insights to your organization.
Mastering Excel’s forecasting functions is for any analyst seeking to drive productivity, achieve cost savings, and enhance customer satisfaction. By understanding and applying these techniques, you can generate accurate and insightful forecasts that inform strategic decisions and contribute to organizational success. Remember that forecasting is both an art and a science – while Excel provides powerful tools, your judgment and understanding of the underlying data remain crucial in producing meaningful predictions.
Media Credit:.