China's Economy Is Larger Than 30 Asian Economies Combined

China's Economy Is Larger Than 30 Asian Economies Combined The world’s second-largest economy sometimes suffers from its own success: it’s hard to comprehend how big it really is.To help put things in perspective, this map, via Visual Capitalist's Pallavi Rao, compares China’s economy with East, Southeast, South, and Central Asia: a combined entity of 30 other countries labeled as “Rest of Asia”.Data is sourced from the UN and the IMF as of 2024. Countries from Western Asia (i.e. the Middle East) and Russia (which spans Europe and Asian continents) haven’t been included, and data was unavailable for North Korea.How China Stacks Up vs. Asian EconomiesWith an $18 trillion economic output in 2024, China’s GDP is nearly $2 trillion larger than 30 economies combined: $16.5 trillion.That list of 30 countries includes other Asian heavyweights like: Japan ($4.1 trillion), India ($3.9 trillion), and South Korea ($1.87 trillion), the world’s 4th, 5th, and 12th largest economies.More than 2.9 billion people inhabit this bloc of countries, compared to China’s 1.4 billion residents. The per capita GDP reveals the imbalance in productivity: $12,870 for China versus $5,583 for the rest of Asia.Why the Chinese Economy Slowdown MattersNow that comprehending the size of China’s economy is somewhat more feasible, it makes more sense why the post-pandemic slowdown has rung alarm bells for economists around the world.It’s easier to think of it less as one country in an economic slump, and more as, say, 30 countries in a bit of a bother.Since 2010, China’s economy has added roughly $1 trillion—the size of Saudi Arabia—every single year. From 2012–2021, China contributed nearly 39% to global growth by itself, more than the G7 countries combined.It’s not an exaggeration to say the world economy would look very different without China—especially for the manufacturing and industrial sectors, where it commands a dominant market position.Falling Chinese demand hurts all the countries who export to China—and this includes large parts of Asia and Africa.Meanwhile, in an effort to sell elsewhere, Chinese businesses have shifted focus to international markets, already putting them in confrontational crosshairs with the U.S. and EU over unfair trade practices. More tariffs could raise the cost of goods and services to consumers around the world.This map is part of a series where we visualize how different countries around the world stack up against their neighbors. Check out how Germany Compares to Half of Europe, or How Africa Can Be Divided into Two Halves for more interesting conversation starters. Tyler DurdenTue, 11/19/2024 - 21:20

featured-image

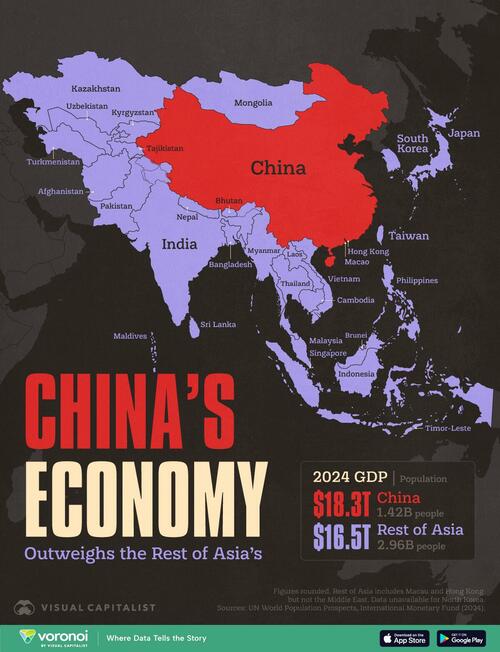
The world’s second-largest economy sometimes suffers from its own success : it’s hard to comprehend how big it really is. To help put things in perspective, this map, via Visual Capitalist's Pallavi Rao, compares China’s economy with East, Southeast, South, and Central Asia: a combined entity of 30 other countries labeled as “Rest of Asia”. Data is sourced from the UN and the IMF as of 2024.

Countries from Western Asia (i.e. the Middle East) and Russia (which spans Europe and Asian continents) haven’t been included, and data was unavailable for North Korea.


With an $18 trillion economic output in 2024, China’s GDP is nearly $2 trillion larger than 30 economies combined: $16.5 trillion. That list of 30 countries includes other Asian heavyweights like: Japan ($4.

1 trillion), India ($3.9 trillion), and South Korea ($1.87 trillion), the world’s 4th, 5th, and 12th largest economies.

More than 2.9 billion people inhabit this bloc of countries, compared to China’s 1.4 billion residents.

The per capita GDP reveals the imbalance in productivity: $12,870 for China versus $5,583 for the rest of Asia. Now that comprehending the size of China’s economy is somewhat more feasible, it makes more sense why the post-pandemic slowdown has rung alarm bells for economists around the world. It’s easier to think of it less as one country in an economic slump, and more as, say, 30 countries in a bit of a bother.

Since 2010, China’s economy has added roughly $1 trillion—the size of Saudi Arabia —every single year. From 2012–2021, China contributed nearly 39% to global growth by itself, more than the G7 countries combined. It’s not an exaggeration to say the world economy would look very different without China—especially for the manufacturing and industrial sectors, where it commands a dominant market position.

Falling Chinese demand hurts all the countries who export to China—and this includes large parts of Asia and Africa. Meanwhile, in an effort to sell elsewhere, Chinese businesses have shifted focus to international markets , already putting them in confrontational crosshairs with the U.S.

and EU over unfair trade practices. More tariffs could raise the cost of goods and services to consumers around the world. This map is part of a series where we visualize how different countries around the world stack up against their neighbors.

Check out how Germany Compares to Half of Europe , or How Africa Can Be Divided into Two Halves for more interesting conversation starters..